实现#
图表 nodes#
AiiDA provenance graph 的 nodes 可分为两大 类型: process nodes** ( ProcessNode ),代表计算或 workflows 的执行;数据 nodes ( Data ),代表数据块。
其中,process nodes 又分为两个子类别:
计算 nodes (
CalculationNode):表示执行代码,创建新数据。它们又分为两个子类:CalcJobNode: Represents the execution of a calculation external to AiiDA, typically via a job batch scheduler (see the concept of calculation jobs).CalcFunctionNode: Represents the execution of a python function (see the concept of calculation functions).
workflow nodes (
WorkflowNode):代表协调执行其他 workflow 和计算的 python 代码,可选择返回它们调用的 processes 创建的数据。它们又被细分为两个子类:WorkChainNode: Represents the execution of a python class instance with built-in checkpoints, such that the process may be paused/stopped/resumed (see the concept of work chains).WorkFunctionNode: Represents the execution of a python function calling other processes (see the concept of work functions).
process nodes 的类层次结构如下图所示。
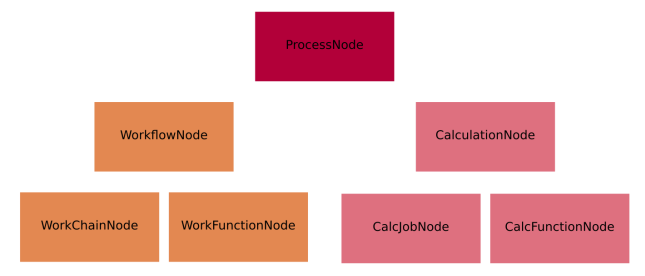
图 21 process nodes ORM 类的层次结构。只有最底层类的实例才会实际进入 provenance graph。上层的两个类主要用于分类,因为它们允许我们在对图进行推理时同时引用多个类,同时也是定义通用功能的地方(参见 processes 部分)。#
对于数据 node,基类 ( Data ) 被子类化,以提供特定于数据类型的功能和对其进行操作的 python 方法。通常情况下,子类的名称会包含 ‘数据’ 一词,但这并不是必须的。下面是几个例子:
Dict: represents a dictionary of key-value pairs - these are parameters of a general nature that do not need to belong to more specific data sub-classesStructureData: represents crystal structure data (containing chemical symbols, atomic positions of the atoms, periodic cell for periodic structures, …)ArrayData: represents generic numerical arrays of data (python numpy arrays)KpointsData: represents a numerical array of k-points data, is a sub-class ofArrayData
更多详细信息,请参见 AiiDA data types 。
在下一节中,我们将介绍 nodes 之间的联系,创建 AiiDA 图,然后通过一些示例来说明我们到目前为止所介绍的内容。
图表链接#
Process node 通过定向链接与其输入和输出数据 node 相连。计算 processes 可以 创建 数据,而 workflow processes 可以 调用 计算并 返回 其输出。请看下图示例,我们用圆形表示**数据 nodes ,用正方形表示 计算 nodes ,用菱形表示 workflow nodes**。
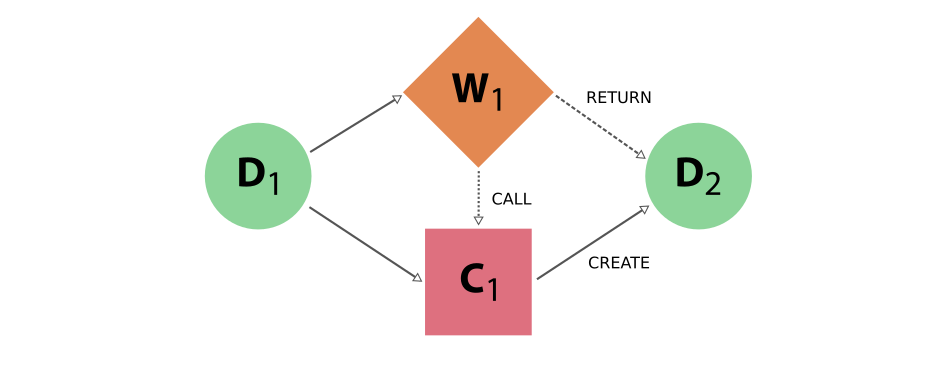
图 22 简单的 provenance graph 代表 workflow (w1) calling a calculation (C1). The workflow takes a single data node (D1) as input, and passes it to the calculation when calling it. The calculation creates a new data node (D2),也是由 workflow node 返回的。#
请注意,进入 D2 的两个链接在样式和名称上的不同是有意为之的,因为是计算 创建 了新数据,而 workflow 只是 返回 了新数据。这种微妙的区别会产生重大影响。通过允许 workflow processes 返回 数据,它也可以 返回 其输入中的数据。
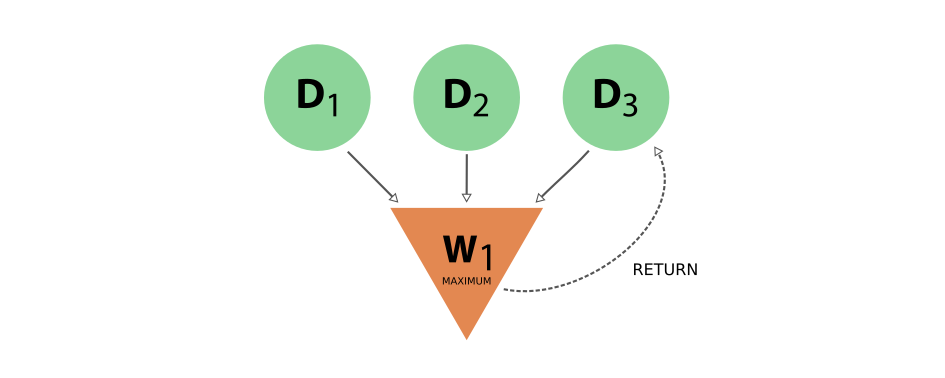
图 23 Provenance graph 示例:workflow node **接收三个 数据 node**作为输入,并 返回 其中一个输入。从 D3 到 W1 的输入链接和从 W1 到 D3 的返回链接在图中引入了一个循环。#
这样的情况在 图 23 中表示,将在 provenance graph 中创建一个循环,破坏 DAG 的 非循环性。为了恢复有向无环图,我们将整个 provenance graph 分成两个平面,如上所述:数据 provenance 和**逻辑 provenance**。这样划分后,数据 provenance 平面上的图的无循环性就恢复了。
从这两个平面来考虑 provenance graph 的另一个好处是,它可以让您以不同的粒度层来检查它。想象一下,一个高层 workflow 调用大量的计算和子 workflow,每个计算和子 workflow 还可能调用更多的子 processes,最终产生并返回一个或多个数据 node,作为其结果。
图表示例#
有了 AiiDA 的 provenance graph 的这些基本定义,让我们来看一些例子。考虑将两个数字 x 和 y 相加,然后将结果与第三个数字 z. This sequence as represented in the provenance graph would look something like what is shown in 图 24 相乘的计算序列。
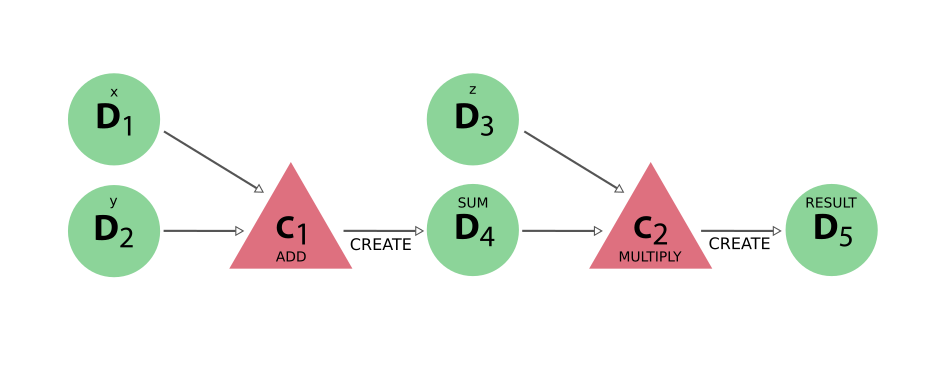
图 24 计算 (x+y)*z 的 DAG。我们有两个简单的计算:C1`表示加法,C:sub:`2`表示乘法。两个数据 nodes D:sub:`1 和 D2 是 C1, which creates the data node D4. Together with D3, D4 的输入,然后形成 C2, which multiplies their values that creates the product, represented by D5 的输入。#
在这个简单的例子中,没有外部 process 来控制这些运算的确切顺序。然而,通过添加一个 workflow 来调用这两个连续的计算,就可以想象出这样的结果,如 图 25 所示。
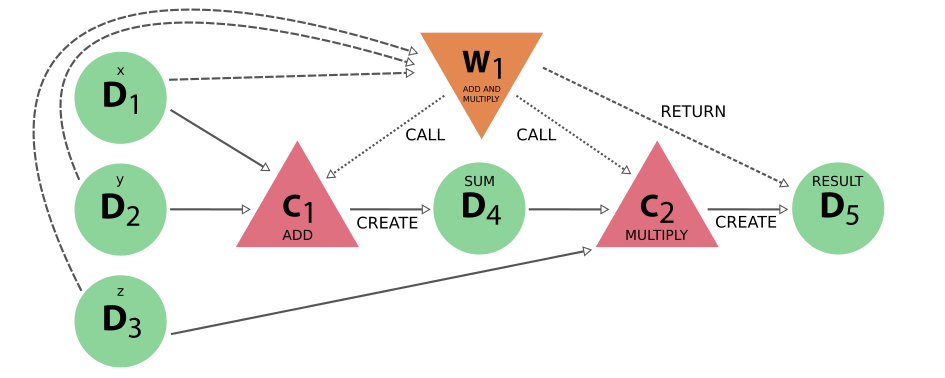
图 25 使用 workflow 进行同样的计算 (x+y)*z。这里的数据 nodes D1, D2, and D3 是 workflow W1, which calls calculation C1 的输入,输入为 D1 和 D:sub:2. It then calls calculation C2, using as inputs D3 和 D4`(由 C:sub:`2). Calculation C2 创建 数据 node D5, which is finally returned by workflow W1.#
请注意,如果我们省略 图 25, one would end up with the exact same graph as shown in 图 24 中 provenance graph 的 workflow nodes 及其所有链接(数据 provenance 图)。